The temperature of the coolant in the heating system. Heating schedule for quality regulation of heat supply based on the average daily outdoor temperature
Each Management Company strive to achieve economical heating costs apartment building. In addition, residents of private houses are trying to come. This can be achieved if a temperature graph is drawn up, which will reflect the dependence of the heat produced by the carriers on weather conditions on the street. Correct use of these data allow optimal distribution of hot water and heating to consumers.
What is a temperature chart
The same mode of operation should not be maintained in the coolant, because outside the apartment the temperature changes. It is she who needs to be guided and, depending on her, change the temperature of the water in heating objects. The dependence of the coolant temperature on outdoor temperature air is compiled by technologists. To compile it, the values \u200b\u200bof the coolant and the outside air temperature are taken into account.
During the design of any building, the size of the equipment providing heat supplied to it, the dimensions of the building itself and the cross-sections of the pipes must be taken into account. In a high-rise building, residents cannot independently increase or decrease the temperature, as it is supplied from the boiler room. Adjustment of the operating mode is always carried out taking into account temperature chart coolant. The temperature scheme itself is also taken into account - if the return pipe supplies water with a temperature above 70 ° C, then the coolant flow will be excessive, but if it is much lower, there is a shortage.
Important! The temperature schedule is drawn up in such a way that at any outdoor air temperature in the apartments a stable optimal heating level of 22 °C is maintained. Thanks to him, even the most severe frosts become not terrible, because the heating systems will be ready for them. If it is -15 ° C outside, then it is enough to track the value of the indicator to find out what the water temperature in the heating system will be at that moment. The more severe the outdoor weather, the hotter the water inside the system should be.
But the level of heating maintained indoors depends not only on the coolant:
- Temperature outside;
- The presence and strength of the wind - its strong gusts significantly affect heat loss;
- Thermal insulation - high-quality processed structural parts of the building help to keep heat in the building. This is done not only during the construction of the house, but also separately at the request of the owners.
Heat carrier temperature table from outdoor temperature
In order to calculate the optimal temperature regime, it is necessary to take into account the characteristics available for heating appliances- batteries and radiators. The most important thing is to calculate their specific power, it will be expressed in W / cm 2. This will most directly affect the transfer of heat from the heated water to the heated air in the room. It is important to take into account their surface power and the drag coefficient available for window openings and outer walls.
After all the values \u200b\u200bare taken into account, you need to calculate the difference between the temperature in the two pipes - at the entrance to the house and at the exit from it. The higher the value in the inlet pipe, the higher in the return pipe. Accordingly, indoor heating will increase below these values.
| Weather outside, С | at the entrance to the building, C | Return pipe, C |
| +10 | 30 | 25 |
| +5 | 44 | 37 |
| 0 | 57 | 46 |
| -5 | 70 | 54 |
| -10 | 83 | 62 |
| -15 | 95 | 70 |
Proper use of the coolant implies attempts by the inhabitants of the house to reduce the temperature difference between the inlet and outlet pipe. It could be construction work for wall insulation from the outside or thermal insulation of external heat supply pipes, insulation of ceilings above a cold garage or basement, insulation of the inside of the house or several works performed simultaneously.
Heating in the radiator must also comply with the standards. In central heating systems, it usually varies from 70 C to 90 C, depending on the outside air temperature. It is important to take into account that in corner rooms can not be less than 20 C, although in other rooms of the apartment it is allowed to drop to 18 C. If the temperature drops to -30 C outside, then the heating in the rooms should rise by 2 C. In the rest of the rooms, the temperature should also increase, provided that in rooms for various purposes it may be different. If there is a child in the room, then it can range from 18 C to 23 C. In pantries and corridors, heating can vary from 12 C to 18 C.
It is important to note! The average daily temperature is taken into account - if the temperature is about -15 C at night, and -5 C during the day, then it will be calculated by the value of -10 C. If it was about -5 C at night, and at daytime it rose to +5 C, then heating is taken into account at a value of 0 C.
Schedule for supplying hot water to the apartment
To deliver to the consumer optimal DHW, CHP should send it as hot as possible. Heating mains are always so long that their length can be measured in kilometers, and the length of apartments is measured in thousands. square meters. Whatever the thermal insulation of the pipes, heat is lost on the way to the user. Therefore, it is necessary to heat the water as much as possible. 
However, water cannot be heated to more than its boiling point. Therefore, a solution was found - to increase the pressure.
It is important to know! As it rises, the boiling point of water shifts upwards. As a result, it reaches the consumer really hot. With an increase in pressure, risers, mixers and taps do not suffer, and all apartments up to the 16th floor can be provided with hot water without additional pumps. In a heating main, water usually contains 7-8 atmospheres, the upper limit usually has 150 with a margin.
It looks like this:
| Boiling temperature | Pressure |
| 100 | 1 |
| 110 | 1,5 |
| 119 | 2 |
| 127 | 2,5 |
| 132 | 3 |
| 142 | 4 |
| 151 | 5 |
| 158 | 6 |
| 164 | 7 |
| 169 | 8 |
Hot water supply to winter time years must be continuous. Exceptions to this rule are accidents on heat supply. Hot water can only be turned off summer period for preventive work. Such work is carried out as in heating systems closed type as well as in open systems.
Economical energy consumption in the heating system can be achieved if certain requirements are met. One of the options is the presence of a temperature chart, which reflects the ratio of the temperature emanating from the heating source to external environment. The value of the values makes it possible to optimally distribute heat and hot water to the consumer.
High-rise buildings are connected mainly to central heating. Sources that convey thermal energy, are boiler houses or CHP. Water is used as a heat carrier. It is heated to a predetermined temperature.
Having passed a full cycle through the system, the coolant, already cooled, returns to the source and reheating begins. Sources are connected to the consumer by thermal networks. Since the environment changes the temperature regime, thermal energy should be regulated so that the consumer receives the required volume.
Heat regulation from central system can be produced in two ways:
- Quantitative. In this form, the flow rate of water changes, but the temperature is constant.
- Qualitative. The temperature of the liquid changes, but its flow rate does not change.
In our systems, the second variant of regulation is used, that is, qualitative. W Here there is a direct relationship between two temperatures: coolant and environment. And the calculation is carried out in such a way as to provide heat in the room of 18 degrees and above.
Hence, we can say that the temperature curve of the source is a broken curve. The change in its directions depends on the temperature difference (coolant and outside air).
Dependency graph may vary.
A particular chart has a dependency on:
- Technical and economic indicators.
- Equipment for a CHP or boiler room.
- climate.
High performance of the coolant provides the consumer with a large thermal energy.
An example of a circuit is shown below, where T1 is the temperature of the coolant, Tnv is the outdoor air:
It is also used, the diagram of the returned coolant. A boiler house or CHP according to such a scheme can evaluate the efficiency of the source. It is considered high when the returned liquid arrives cooled.
The stability of the scheme depends on the design values of the liquid flow of high-rise buildings. If the flow rate through the heating circuit increases, the water will return uncooled, as the flow rate will increase. Conversely, at a minimum flow, the return water will be sufficiently cooled.
The supplier's interest is, of course, in the flow of return water in a chilled state. But there are certain limits to reduce the flow, since a decrease leads to losses in the amount of heat. The consumer will begin to lower the internal degree in the apartment, which will lead to a violation of building codes and discomfort to the inhabitants.
What does it depend on?
The temperature curve depends on two quantities: outside air and coolant. Frosty weather leads to an increase in the degree of coolant. When designing a central source, the size of the equipment, the building and the section of pipes are taken into account.
The value of the temperature leaving the boiler room is 90 degrees, so that at minus 23°C, it would be warm in the apartments and have a value of 22°C. Then the return water returns to 70 degrees. Such norms correspond to normal and comfortable living in the house.
Analysis and adjustment of operating modes is carried out using a temperature scheme. For example, the return of a liquid with an elevated temperature will speak of high costs coolant. Underestimated data will be considered as a consumption deficit.
Previously, for 10-storey buildings, a scheme with calculated data of 95-70°C was introduced. The buildings above had their chart 105-70°C. Modern new buildings may have a different scheme, at the discretion of the designer. More often, there are diagrams of 90-70°C, and maybe 80-60°C.
Temperature chart 95-70:
 Temperature chart 95-70
 How is it calculated?
The control method is selected, then the calculation is made. The calculation-winter and reverse order of water inflow, the amount of outside air, the order at the break point of the diagram are taken into account. There are two diagrams, where one of them considers only heating, the other one considers heating with hot water consumption.
For an example calculation, we will use methodological development Roskommunenergo.
The initial data for the heat generating station will be:
- Tnv- the amount of outside air.
- TVN- indoor air.
- T1- coolant from the source.
- T2- return flow of water.
- T3- the entrance to the building.
We will consider several options for supplying heat with a value of 150, 130 and 115 degrees.
At the same time, at the exit they will have 70 ° C.
The results obtained are brought into a single table for the subsequent construction of the curve:
So we got three various schemes which can be taken as a basis. It would be more correct to calculate the diagram individually for each system. Here we considered the recommended values, without taking into account the climatic features of the region and the characteristics of the building.
To reduce power consumption, it is enough to choose a low-temperature order of 70 degrees and uniform distribution of heat throughout the heating circuit will be ensured. The boiler should be taken with a power reserve so that the load of the system does not affect quality work unit.
Adjustment
 Heating regulator
 Automatic control is provided by the heating controller.
It includes the following details:
- Computing and matching panel.
- Executive device at the water supply line.
- Executive device, which performs the function of mixing liquid from the returned liquid (return).
- boost pump and a sensor on the water supply line.
- Three sensors (on the return line, on the street, inside the building). There may be several in a room.
The regulator covers the liquid supply, thereby increasing the value between the return and supply to the value provided by the sensors.
To increase the flow, there is a booster pump, and the corresponding command from the regulator. The incoming flow is regulated by a "cold bypass". That is, the temperature drops. Some of the liquid that circulates along the circuit is sent to the supply.
Information is taken by sensors and transmitted to control units, as a result of which flows are redistributed, which provide a rigid temperature scheme for the heating system.
Sometimes, a computing device is used, where the DHW and heating regulators are combined.
The hot water regulator has more a simple circuit management. The hot water sensor regulates the flow of water with a stable value of 50°C.
Regulator benefits:
- The temperature regime is strictly maintained.
- Exclusion of liquid overheating.
- Fuel economy and energy.
- The consumer, regardless of distance, receives heat equally.
Table with temperature chart
The operating mode of the boilers depends on the weather of the environment.
If we take various objects, for example, a factory building, a multi-storey building and a private house, all will have an individual heat chart.
In the table, we show the temperature diagram of the dependence of residential buildings on the outside air:
| Outside temperature | Temperature of network water in the supply pipeline | Temperature of network water in the return pipeline |
| +10 | 70 | 55 |
| +9 | 70 | 54 |
| +8 | 70 | 53 |
| +7 | 70 | 52 |
| +6 | 70 | 51 |
| +5 | 70 | 50 |
| +4 | 70 | 49 |
| +3 | 70 | 48 |
| +2 | 70 | 47 |
| +1 | 70 | 46 |
| 0 | 70 | 45 |
| -1 | 72 | 46 |
| -2 | 74 | 47 |
| -3 | 76 | 48 |
| -4 | 79 | 49 |
| -5 | 81 | 50 |
| -6 | 84 | 51 |
| -7 | 86 | 52 |
| -8 | 89 | 53 |
| -9 | 91 | 54 |
| -10 | 93 | 55 |
| -11 | 96 | 56 |
| -12 | 98 | 57 |
| -13 | 100 | 58 |
| -14 | 103 | 59 |
| -15 | 105 | 60 |
| -16 | 107 | 61 |
| -17 | 110 | 62 |
| -18 | 112 | 63 |
| -19 | 114 | 64 |
| -20 | 116 | 65 |
| -21 | 119 | 66 |
| -22 | 121 | 66 |
| -23 | 123 | 67 |
| -24 | 126 | 68 |
| -25 | 128 | 69 |
| -26 | 130 | 70 |
SNiP
There are certain norms that must be observed in the creation of projects for heating networks and the transportation of hot water to the consumer, where the supply of water vapor must be carried out at 400 ° C, at a pressure of 6.3 bar. The supply of heat from the source is recommended to be released to the consumer with values of 90/70 °C or 115/70 °C.
Regulatory requirements should be followed for compliance with the approved documentation with the obligatory coordination with the Ministry of Construction of the country.
The task of organizations serving houses and buildings is to maintain the standard temperature. The temperature curve of heating directly depends on the temperature outside.
There are three heating systems
- District heating large boiler house (CHP) located at a considerable distance from the city. In this case, the heat supply organization, taking into account heat loss in networks, selects a system with a temperature graph: 150/70, 130/70 or 105/70. The first digit is the temperature of the water in the supply pipe, the second digit is the temperature of the water in the return pipe.
- Small boiler houses that are located near residential buildings. In this case, the temperature curve 105/70, 95/70 is selected.
- Individual boiler installed on a private house. The most acceptable schedule is 95/70. Although it is possible to reduce the supply temperature even more, since there will be practically no heat loss. Modern boilers operate in automatic mode and maintain a constant temperature in the supply heat pipe. The 95/70 temperature chart speaks for itself. The temperature at the entrance to the house should be 95 ° C, and at the exit - 70 ° C.
IN Soviet times when everything was state-owned, all the parameters of the temperature charts were maintained. If according to the schedule there should be a supply temperature of 100 degrees, then this will be so. Such a temperature cannot be supplied to residents, so elevator units were designed. Water from the return pipeline, cooled down, was mixed into the supply system, thereby lowering the supply temperature to the standard one. In our time of universal economy, the need for elevator nodes is no longer necessary. All heat supply organizations switched to the temperature chart of the heating system 95/70. According to this graph, the coolant temperature will be 95 °C when the outside temperature is -35 °C. As a rule, the temperature at the entrance to the house no longer requires dilution. Therefore, all elevator units must be eliminated or reconstructed. Instead of conical sections that reduce both the speed and volume of the flow, install straight pipes. Seal the supply pipe from the return pipeline with a steel plug. This is one of the heat saving measures. It is also necessary to insulate the facades of houses, windows. Change old pipes and batteries to new ones - modern ones. These measures will increase the air temperature in dwellings, which means you can save on heating temperature. Lowering the temperature on the street is immediately reflected in the residents in the receipts.

Most Soviet cities were built with an "open" heating system. This is when water from the boiler room comes directly to consumers in homes and is used for personal needs of citizens and heating. During the reconstruction of systems and the construction of new heating systems, a "closed" system is used. The water from the boiler house reaches the heating point in the microdistrict, where it heats the water to 95 °C, which goes to the houses. It turns out two closed rings. This system allows heat supply organizations to significantly save resources for heating water. Indeed, the volume of heated water leaving the boiler room will be almost the same at the entrance to the boiler room. There is no need to get cold water into the system.
Exist guidelines building temperature heating schedules, approved by the Government of the Russian Federation. The essence of the methods boils down to: how much cubic meters needs to be heated and how many people should use hot water.
Temperature charts are:
- optimal . The heat resource of the boiler room is used exclusively for heating houses. Temperature control takes place in the boiler room. The supply temperature is 95 °C.
- elevated . The heat resource of the boiler house is used for heating houses and hot water supply. A two-pipe system enters the house. One pipe is heating, the other pipe is hot water supply. Supply temperature 80 - 95 °C.
- adjusted . The heat resource of the boiler house is used for heating houses and hot water supply. One-pipe system approaches the house. From one pipe in the house, a heat resource is taken for heating and hot water for residents. Supply temperature - 95 - 105 °C.
How to carry out the temperature heating schedule. It is possible in three ways:
- quality (regulation of the temperature of the coolant).
- quantitative (regulation of the coolant volume by turning on additional pumps on the return pipeline, or installing elevators and washers).
- qualitative-quantitative (to regulate both the temperature and the volume of the coolant).
The quantitative method prevails, which is not always able to withstand the heating temperature graph.
Fight against heat supply organizations. This struggle is waged by management companies. By law, the management company is obliged to conclude an agreement with the heat supply organization. Will it be a contract for the supply of heat resources or just an agreement on interaction, the management company decides. An annex to this agreement will be a temperature schedule for heating. The heat supply organization is obliged to approve the temperature schemes in the city administration. The heat supply organization supplies the heat resource to the wall of the house, that is, to the metering stations. By the way, the legislation establishes that thermal workers are obliged to install metering stations in houses at their own expense with an installment payment of the cost for residents. So, having metering devices at the entrance and exit from the house, you can control the heating temperature daily. We take the temperature table, look at the air temperature on the weather site and find in the table the indicators that should be. If there are deviations, you need to complain. Even if the deviations are higher, residents will pay more. At the same time, the windows will be opened and the rooms will be ventilated. It is necessary to complain about insufficient temperature to the heat supply organization. If there is no response, we write to the city administration and Rospotrebnadzor.
Until recently, there was a multiplying coefficient on the cost of heat for residents of houses that were not equipped with common house meters. Due to the sluggishness of managing organizations and thermal workers, ordinary residents suffered.
An important indicator in the heating temperature chart is the return temperature of the network. In all graphs, this is an indicator of 70 ° C. In severe frosts, when heat losses increase, heat supply organizations are forced to turn on additional pumps on the return pipeline. This measure increases the speed of water movement through the pipes, and, therefore, the heat transfer increases, and the temperature in the network is maintained.
Again, during the period of general savings, it is very problematic to force thermal workers to turn on additional pumps, which means increasing electricity costs.
The heating temperature graph is calculated based on the following indicators:
- ambient air temperature;
- supply pipeline temperature;
- return pipeline temperature;
- the amount of heat energy consumed at home;
- required amount of thermal energy.
For different rooms temperature curve is different. For children's institutions (schools, gardens, palaces of art, hospitals), the temperature in the room should be between +18 and +23 degrees according to sanitary and epidemiological standards.
- For sports facilities - 18 °C.
- For residential premises - in apartments not lower than +18 °C, in corner rooms + 20 °C.
- For non-residential premises - 16-18 ° C. Based on these parameters, heating schedules are built.
It is easier to calculate the temperature schedule for a private house, since the equipment is mounted right in the house. zealous owner will carry out heating in the garage, bathhouse, outbuildings. The load on the boiler will increase. Counting heat load depending on the maximum low temperatures air of the past. We select equipment by power in kW. The most cost-effective and environmentally friendly boiler is natural gas. If gas is brought to you, this is already half the battle done. You can also use bottled gas. At home, you do not have to adhere to standard temperature schedules of 105/70 or 95/70, and it does not matter that the temperature in the return pipeline is not 70 ° C. Adjust the network temperature to your liking.
By the way, many city dwellers would like to put individual counters on the heat and control the temperature chart yourself. Contact the heat supply companies. And there they hear such answers. Most of the houses in the country are built on a vertical heating system. Water is supplied from the bottom - up, less often: from top to bottom. With such a system, the installation of heat meters is prohibited by law. Even if a specialized organization installs these meters for you, the heat supply organization simply will not accept these meters for operation. That is, savings will not work. Installation of meters is possible only with horizontal heating distribution.
In other words, when a heating pipe comes into your home not from above, not from below, but from the entrance corridor - horizontally. At the place of entry and exit of heating pipes, individual heat meters can be installed. Installation of such counters pays off in two years. All houses are now being built with just such a wiring system. Heating appliances are equipped with control knobs (taps). If the temperature in the apartment is high in your opinion, then you can save money and reduce the heating supply.
Only ourselves we will save from freezing.
The basis of an economical approach to energy consumption in a heating system of any type is the temperature graph. Its parameters indicate the optimal value of water heating, thereby optimizing costs. In order to apply these data in practice, it is necessary to learn more about the principles of its construction.
Terminology
Temperature graph - the optimal value of heating the coolant to create comfortable temperature in room. It consists of several parameters, each of which directly affects the quality of the entire heating system.
- The temperature in the inlet and outlet pipes of the heating boiler.
- The difference between these indicators of heating the coolant.
- Temperature indoors and outdoors.
The latter characteristics are decisive for the regulation of the first two. Theoretically, the need to increase the heating of water in the pipes comes with a decrease in the temperature outside. But how much should be increased so that the heating of the air in the room is optimal? To do this, draw up a graph of the dependence of the parameters of the heating system.
It takes into account the parameters heating system and residential building. For centralized heating, the following temperature parameters of the system are accepted:
- 150°C/70°C. Before reaching the users, the coolant is diluted with water from the return pipe to normalize the incoming temperature.
- 90°C/70°C. In this case, there is no need to install equipment for mixing streams.
According to the current parameters of the system, utilities must monitor compliance with the heat carrier heating value in return pipe. If this parameter is less than normal, it means that the room is not warming up properly. The excess indicates the opposite - the temperature in the apartments is too high.
Temperature chart for a private house
The practice of drawing up such a schedule for autonomous heating not very developed. This is due to its fundamental difference from the centralized one. It is possible to control the water temperature in the pipes in manual and automatic mode. If the installation of sensors for automatic control of the operation of the boiler and thermostats in each room was taken into account during the design and practical implementation, then there will be no urgent need to calculate the temperature schedule.
But for calculating future expenses depending on weather conditions, it will be indispensable. In order to make it according to the current rules, the following conditions must be taken into account:

Only after these conditions are met, you can proceed to the calculation part. At this stage, difficulties may arise. The correct calculation of an individual temperature graph is a complex mathematical scheme that takes into account all possible indicators.
However, to facilitate the task, there are ready-made tables with indicators. The following are examples of the most common operating modes heating equipment. As initial conditions The following inputs were taken:
- The minimum air temperature outside is 30°С
- The optimum room temperature is +22°C.
Based on these data, schedules were drawn up for the following types of heating systems.

It is worth remembering that these data do not take into account the design features of the heating system. They only show the recommended values \u200b\u200bof the temperature and power of heating equipment, depending on weather conditions.
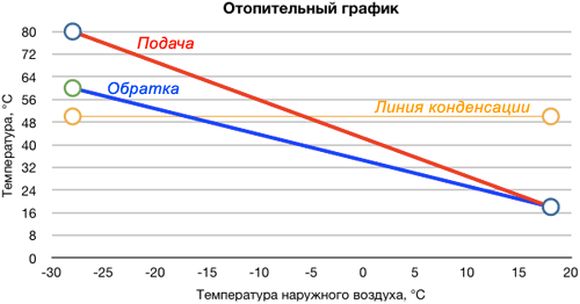
Looking through the statistics of visits to our blog, I noticed that search phrases such as, for example, appear very often “What should be the coolant temperature at minus 5 outside?”. Decided to post the old one. graph of quality regulation of heat supply based on the average daily outdoor temperature. I want to warn those who, on the basis of these figures, will try to sort out relations with housing departments or heating networks: heating schedules for each individual locality different (I wrote about this in an article). Thermal networks in Ufa (Bashkiria) operate according to this schedule.
I also want to draw attention to the fact that regulation occurs according to average daily outside temperature, so if, for example, outside at night minus 15 degrees, and during the day minus 5, then the coolant temperature will be maintained in accordance with the schedule minus 10 o C.
As a rule, the following temperature charts are used: 150/70 , 130/70 , 115/70 , 105/70 , 95/70 . The schedule is selected depending on the specific local conditions. House heating systems operate according to schedules 105/70 and 95/70. According to schedules 150, 130 and 115/70, main heat networks operate.
Let's look at an example of how to use the chart. Suppose the temperature outside is minus 10 degrees. Heating network work according to the temperature schedule 130/70 , which means at -10 o С the temperature of the heat carrier in the supply pipeline of the heating network must be 85,6 degrees, in the supply pipeline of the heating system - 70.8 o C with a schedule of 105/70 or 65.3 about C on a 95/70 schedule. The temperature of the water after the heating system must be 51,7 about S.
As a rule, the temperature values in the supply pipeline of heat networks are rounded off when setting the heat source. For example, according to the schedule, it should be 85.6 ° C, and 87 degrees are set at the CHP or boiler house.
| Temperature outdoor air Tnv, o C |
Temperature of network water in the supply pipeline T1, about C |
Water temperature in the supply pipe of the heating system T3, about C |
Water temperature after heating system T2, about C |
|||
|---|---|---|---|---|---|---|
| 150 | 130 | 115 | 105 | 95 | ||
| 8 | 53,2 | 50,2 | 46,4 | 43,4 | 41,2 | 35,8 |
| 7 | 55,7 | 52,3 | 48,2 | 45,0 | 42,7 | 36,8 |
| 6 | 58,1 | 54,4 | 50,0 | 46,6 | 44,1 | 37,7 |
| 5 | 60,5 | 56,5 | 51,8 | 48,2 | 45,5 | 38,7 |
| 4 | 62,9 | 58,5 | 53,5 | 49,8 | 46,9 | 39,6 |
| 3 | 65,3 | 60,5 | 55,3 | 51,4 | 48,3 | 40,6 |
| 2 | 67,7 | 62,6 | 57,0 | 52,9 | 49,7 | 41,5 |
| 1 | 70,0 | 64,5 | 58,8 | 54,5 | 51,0 | 42,4 |
| 0 | 72,4 | 66,5 | 60,5 | 56,0 | 52,4 | 43,3 |
| -1 | 74,7 | 68,5 | 62,2 | 57,5 | 53,7 | 44,2 |
| -2 | 77,0 | 70,4 | 63,8 | 59,0 | 55,0 | 45,0 |
| -3 | 79,3 | 72,4 | 65,5 | 60,5 | 56,3 | 45,9 |
| -4 | 81,6 | 74,3 | 67,2 | 62,0 | 57,6 | 46,7 |
| -5 | 83,9 | 76,2 | 68,8 | 63,5 | 58,9 | 47,6 |
| -6 | 86,2 | 78,1 | 70,4 | 65,0 | 60,2 | 48,4 |
| -7 | 88,5 | 80,0 | 72,1 | 66,4 | 61,5 | 49,2 |
| -8 | 90,8 | 81,9 | 73,7 | 67,9 | 62,8 | 50,1 |
| -9 | 93,0 | 83,8 | 75,3 | 69,3 | 64,0 | 50,9 |
| -10 | 95,3 | 85,6 | 76,9 | 70,8 | 65,3 | 51,7 |
| -11 | 97,6 | 87,5 | 78,5 | 72,2 | 66,6 | 52,5 |
| -12 | 99,8 | 89,3 | 80,1 | 73,6 | 67,8 | 53,3 |
| -13 | 102,0 | 91,2 | 81,7 | 75,0 | 69,0 | 54,0 |
| -14 | 104,3 | 93,0 | 83,3 | 76,4 | 70,3 | 54,8 |
| -15 | 106,5 | 94,8 | 84,8 | 77,9 | 71,5 | 55,6 |
| -16 | 108,7 | 96,6 | 86,4 | 79,3 | 72,7 | 56,3 |
| -17 | 110,9 | 98,4 | 87,9 | 80,7 | 73,9 | 57,1 |
| -18 | 113,1 | 100,2 | 89,5 | 82,0 | 75,1 | 57,9 |
| -19 | 115,3 | 102,0 | 91,0 | 83,4 | 76,3 | 58,6 |
| -20 | 117,5 | 103,8 | 92,6 | 84,8 | 77,5 | 59,4 |
| -21 | 119,7 | 105,6 | 94,1 | 86,2 | 78,7 | 60,1 |
| -22 | 121,9 | 107,4 | 95,6 | 87,6 | 79,9 | 60,8 |
| -23 | 124,1 | 109,2 | 97,1 | 88,9 | 81,1 | 61,6 |
| -24 | 126,3 | 110,9 | 98,6 | 90,3 | 82,3 | 62,3 |
| -25 | 128,5 | 112,7 | 100,2 | 91,6 | 83,5 | 63,0 |
| -26 | 130,6 | 114,4 | 101,7 | 93,0 | 84,6 | 63,7 |
| -27 | 132,8 | 116,2 | 103,2 | 94,3 | 85,8 | 64,4 |
| -28 | 135,0 | 117,9 | 104,7 | 95,7 | 87,0 | 65,1 |
| -29 | 137,1 | 119,7 | 106,1 | 97,0 | 88,1 | 65,8 |
| -30 | 139,3 | 121,4 | 107,6 | 98,4 | 89,3 | 66,5 |
| -31 | 141,4 | 123,1 | 109,1 | 99,7 | 90,4 | 67,2 |
| -32 | 143,6 | 124,9 | 110,6 | 101,0 | 94,6 | 67,9 |
| -33 | 145,7 | 126,6 | 112,1 | 102,4 | 92,7 | 68,6 |
| -34 | 147,9 | 128,3 | 113,5 | 103,7 | 93,9 | 69,3 |
| -35 | 150,0 | 130,0 | 115,0 | 105,0 | 95,0 | 70,0 |
Please do not focus on the diagram at the beginning of the post - it does not correspond to the data from the table.
Calculation of the temperature graph
The method for calculating the temperature graph is described in the reference book (Chapter 4, p. 4.4, p. 153,).
This is a rather laborious and lengthy process, since several values must be calculated for each outdoor temperature: T 1, T 3, T 2, etc.
To our joy, we have a computer and a MS Excel spreadsheet. A colleague at work shared with me a ready-made table for calculating the temperature graph. She was once made by his wife, who worked as an engineer for a group of regimes in thermal networks.

In order for Excel to calculate and build a graph, it is enough to enter several initial values:
- design temperature in the supply pipeline of the heating network T 1
- design temperature in the return pipeline of the heating network T 2
- design temperature in the supply pipe of the heating system T 3
- Outside temperature T n.v.
- Indoor temperature T v.p.
- coefficient " n» (it is usually not changed and is equal to 0.25)
- Minimum and maximum cut of the temperature graph Cut min, Cut max.

All. nothing more is required of you. The results of the calculations will be in the first table of the sheet. It is highlighted in bold.
The charts will also be rebuilt for the new values.

The table also considers the temperature of direct network water, taking into account wind speed.